10-44 Connection Received
2021 West Coast Hackathon
🏆 1st Place Winner 🏆
10-44
Connection Received
Making Friends on the Road
10-44 Connection Received is a buddy-matching mobile app to help long-haul truck drivers combat loneliness on the open road. Many truck drivers no longer use CB radios, communicating with their phones instead. This app can help you find other drivers who may have similar interests and drivers who want to talk and make friends on the road.
The Hackathon
The West Coast Hackathon was available to General Assembly alumni and took place during the 2021 winter holiday season. Hosted by several West Coast General Assembly campuses, it attracted designers and developers worldwide. The task was to create a digital product that would address the challenges delivery drivers face during the holiday season.

The UX Design Team

The Software Engineer Team
Team Merry, Merry
Our team was called Merry, Merry which means Merry Christmas in trucker’s lingo. We had 3 days, 4 UX designers, and 4 software engineers. Our team decided to focus our attention on long-haul truck drivers because we found that these truck drivers
Spend most of their time driving, taking small breaks for food and restroom
27.9% of long-haul truck drivers struggle with loneliness
26.9% of long-haul truck drivers suffer from some sort of depression
The holiday season is the busiest time of year for them
Many are unable to celebrate holidays with their families and friends
Many drivers were not comfortable with therapy but would be open to speaking to other drivers on the road. Sometimes talking with another person going through the same day-to-day is therapy in and of itself.
Team Collaboration
It was the first time that many of us had the opportunity to collaborate in a cross-functional team. This opportunity for me to work with software developers greatly enhanced my understanding of what the developers may see when they look at my design work. If not well-documented, developers' interpretation of my design could be different from what I, as the designer meant. I realized how a developer may see my design differently than I meant and how many things could go wrong if my concepts are not clearly defined.
As a result, I better understand how important it is that my designs explain what I want and leave nothing to misinterpretation. If in doubt, talk to that team member because it is crucial to have excellent communication. I don’t want to ask someone to do their work again because my design didn’t show what I wanted.
The designers primarily used Figma and Miro to design and Notion to organize. Our collective team used Google slides for the presentation.
My work
I did user research including user interviews and organized this data into an affinity map. I created the persona, conducted user testing for both the mid- and high-fidelity prototypes, contributed to building the slide deck, and participated in the final presentation to the judges.
Key Interview Findings by Affinity Mapping
Most drivers:
No longer use CB radios to communicate
Primarily use phones and Discord
Are technologically savvy
Have many apps related to their work
Are receptive to talking to new people while driving

The Persona
Traditionally, personas contain information that isn’t relevant to app-design research, many of the common demographics used closely align with the needs of marketers. Demographics we did not include in the persona are gender, race, age, family size, education level, and income. We feel that this information may be limiting or exclude users not represented. Research has shown that this job is no longer only performed by white men. Many people of color and women are drivers and we suspect people of non-conforming gender may also be doing this profession.
Instead, we chose to focus on the user’s wants, needs, technical use skills, workflow needs, key behaviors, and pain points as these are more likely to be universal and inclusive traits among truck drivers.

Non-traditional persona of a long haul truck driver.
Early Mid-Fidelity screens


User flow

User flow plan
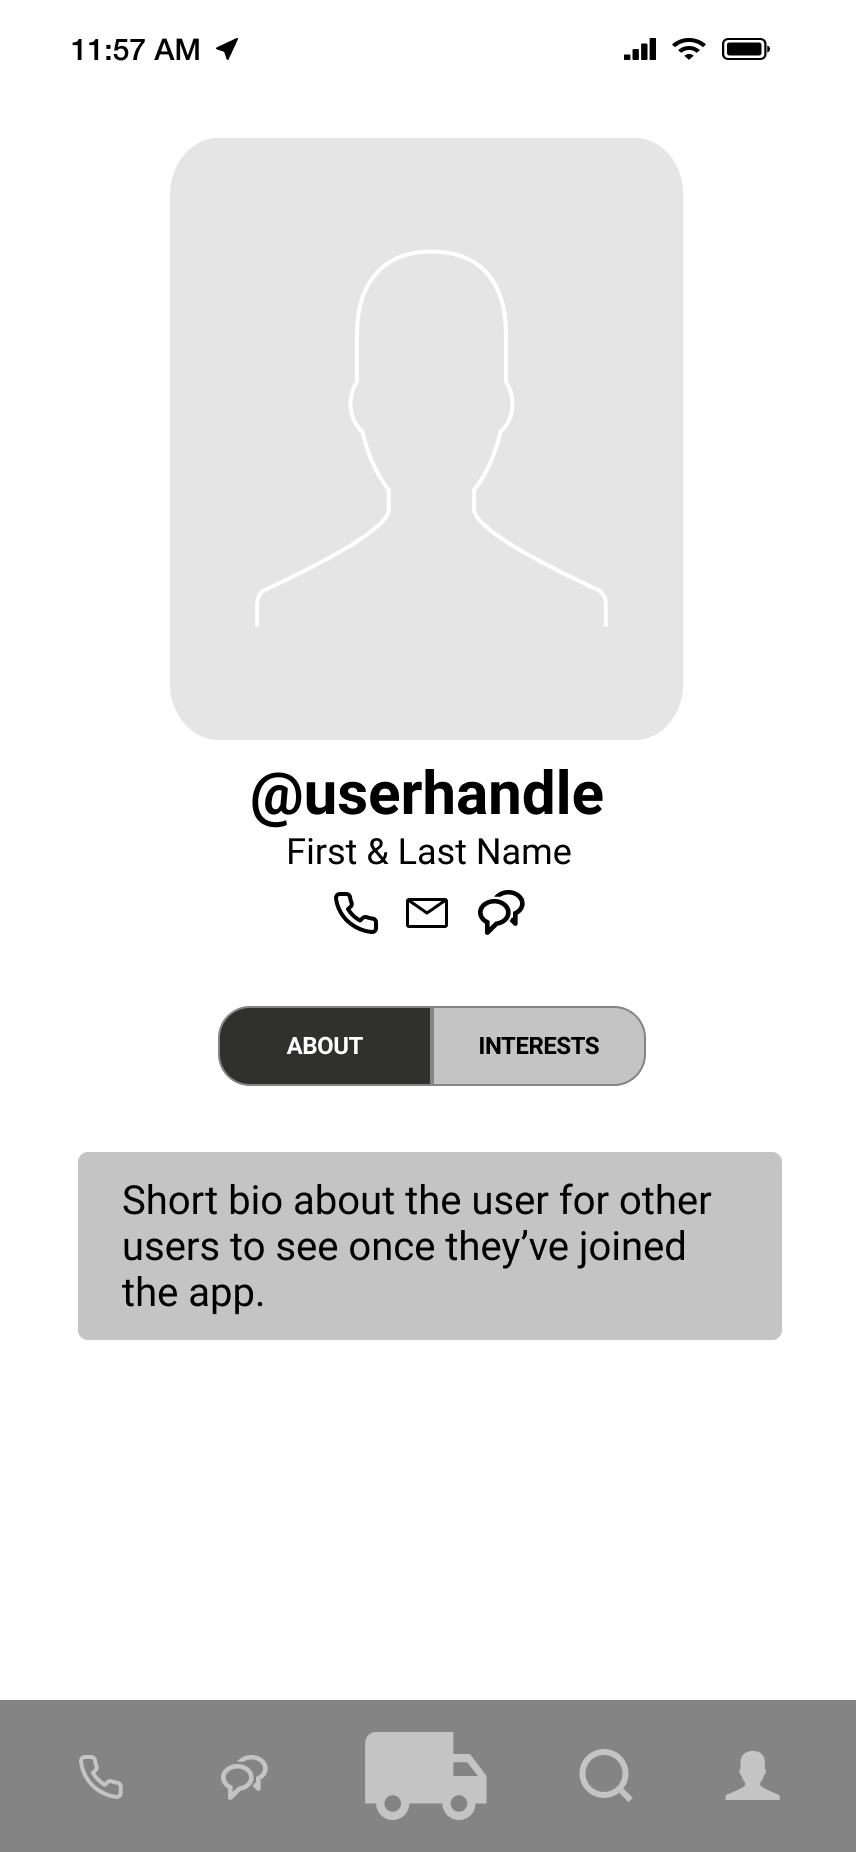
High-Fidelity Screens


Usability Testing
Via Maze users were requested users to:
Sign in
Send a buddy request
Open a message thread
Navigate to edit profile

Results of usability test via Figma prototype
Users liked the overall concept
Users liked the overall interaction & UI
Users like the “interest” choices
“Tinder” for long-haul truckers

Usability test statistics
81.25 System Usability Score (SUS)
25% direct success (2 users)
50% indirect success (4 users)
25% bounce rate (2 users)

The System Usability Scale (SUS)
A popular measure of perceived usability
An inexpensive, yet effective tool for assessing the usability of a product
A system can be just about anything a human interacts with: software apps (business and consumer), hardware, mobile devices, mobile apps, websites, or voice user interfaces
It’s a 10-item questionnaire scored on a 101-point scale and provides a measure of a user’s perception of the usability of a “system”
It provides an easy-to-understand score from 0 (negative) to 100 (positive)
What is considered a good score?
68 is considered a good SUS score
The average SUS score from all 500 studies is a 68
A SUS score above a 68 would be considered above average and anything below 68 is below average
The best way to interpret your score is to convert it to a percentile rank through a process called normalizing.
Next Steps
Add your location, show your general location, would not give pinprick specific location
Search, search other drivers by your location
Ability to see online/offline buddies, See if your connections/buddies are online or not
Enable online/offline status, turnoff/on your visible online status
Community message board(s), Community members can post messages to the community, information about the road, announcements, help needed, offering or looking for work
Suggest an interest, ability to suggest an interest not listed
Call feature, calling your buddy within the app